


Wanting to know how your supply chain compares to others in your industry (or the market at large) is natural. After all, knowing where you stand can influence your goals, planning, and strategies in the future.
Good news folks, now there’s an easy way to estimate how your truckload strategy is performing. And you don’t have to rely on anecdotal stories or resort to corporate espionage to find out. Researchers at MIT used data from C.H. Robinson and TMC to measure perfect truckload shipments and discover the difference between Leaders and Laggards in truckload service and rates.
My recent conversation with Adrian Gonzales on Talking Logistics helps answer some high level questions about this research.
What is a perfect shipment?
The researchers ranked shippers by combining on time pickup (OTP), on time delivery (OTD), and first tender acceptance (FTA). FTA is the percent of the time that your intended supplier accepts your shipment tender the first time you offer it. Research shows high FTA correlates with lower rates. By multiplying these percentages, you can determine your perfect truckload shipment percentage.
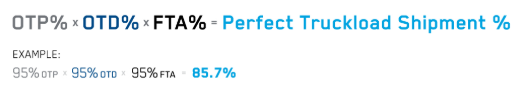
We’ve built a tool to help you quickly determine your perfect truckload shipment percentage. Use the C.H. Robinson Truckload Performance Rating™ tool below to get your results. From there, you can use that number to determine if you’re a leader or a laggard in truckload shipping.
How do truckload Leaders compare to Laggards?
The data shows three distinct groupings of perfect truckload shipment scores. Where does your score fall?
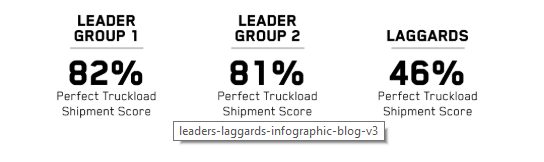
Digging in deeper, we learned that Leaders and Laggards both use a diversified mix of asset-based carriers and non-asset based suppliers. But the key difference is that Leaders tend to use fewer, higher-performing suppliers than their peers.
Once you have your perfect truckload shipment percentage, all shippers should be looking for ways to improve—even the Leaders. The fact is no one will ever score 100% for perfect truckload shipments. And the changing nature of transportation means there is always room for improvement.
The research shows that shippers that focus on these three areas have higher OTP, OTD, and FTA and are therefore more likely to fall into the leader category:
- Rationalize your supplier base. Utilize both asset carriers and brokers strategically, and use fewer suppliers per origin.
- Choose suppliers with focus in your corridors. Use suppliers who have more capacity in the lanes you serve to better know your regional markets.
- Identify top performing suppliers. Research shows both asset carriers and brokers can be top performers. Engage high-performing suppliers who have more capacity in the lanes you serve and know the geographical area.
There’s always more to explore
Use the results of this research to set a baseline for your own truckload strategy’s improvement initiatives. For more details about the research, visit our interactive research paper or watch the entire episode of Talking Logistics with Adrian Gonzalez.